


Bitcoin Ethereum and XRP Crash Three Critical Support Levels That Could Shape the Next Move
Crypto sell-offs move fast, but the real story usually starts when price reaches support. That is where weak hands are forced out, dip buyers step in, and the market shows whether the crash is just a shake-out or the start of a deeper slide.
Bitcoin, Ethereum and XRP often move together during risk-off sessions, but they do not always recover in the same way. Bitcoin tends to set the tone. Ethereum shows whether traders still want higher-beta crypto exposure. XRP often gives a cleaner read on speculative appetite because its moves can be sharp, crowded and heavily sentiment-driven.
The key is not to guess the bottom. The key is to watch the three support zones that can change the next move from panic to recovery, or from a pullback to a full breakdown.
This article is for informational purposes only and is not financial advice. Crypto assets are volatile, and support levels can fail quickly.

Why support levels matter more during a crash
A normal pullback gives traders time to think. A crash does not. Candles stretch, spreads widen, fear rises, and the market starts reacting to levels that were barely noticed a few days earlier.
Support is not magic. It is simply an area where buyers have shown interest before, or where sellers may start taking profit. During a heavy sell-off, support matters because it can reveal three things:
Whether long-term buyers still trust the trend
Whether short sellers are ready to cover
Whether late sellers are running out of momentum
The mistake many traders make is treating support as one exact price. In liquid crypto markets, support is usually a zone, not a single line. A wick below support can be meaningful, but the daily close often tells the cleaner story.
That is why the next move in Bitcoin, Ethereum and XRP is likely to depend less on one dramatic candle and more on how price behaves around the most obvious support areas.
A simple way to read support is to ask four questions:
What to check | Why it matters |
Does price reclaim the level quickly? | Fast reclaiming shows buyers are defending the zone. |
Does volume rise near support? | Strong activity can signal real positioning, not just noise. |
Does price close below support? | A close below the zone carries more weight than a brief wick. |
Does the next bounce fail? | A weak bounce after a break can turn old support into resistance. |
If all three major assets lose their key zones at once, the market often becomes much more fragile. If Bitcoin holds first, Ethereum stabilises next, and XRP stops making lower lows, the crash can lose force.
The first critical support level sits under Bitcoin
Bitcoin still acts as the market’s anchor. When Bitcoin breaks down, the rest of the crypto market usually struggles to hold support for long. When Bitcoin stabilises, even shaky altcoins can get a relief rally.
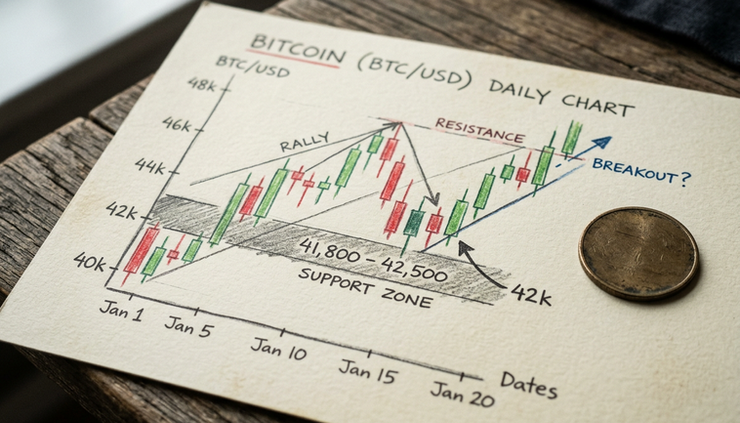
The first critical level to watch is Bitcoin’s most recent major daily swing low. That is the last area where buyers clearly stopped a decline and pushed price meaningfully higher. It is critical because many traders build their risk around it.
This level matters more than a random round number. Round numbers attract attention, but the swing low shows where the market actually changed direction.
To find it, look at the daily chart and mark the most obvious low that came before the latest recovery attempt. Then watch how price behaves if it returns to that zone.
A positive reaction would look like this:
Price dips into the zone but does not spend much time below it
The daily candle closes back above support
The next candle holds the reclaim instead of fading straight away
Bitcoin dominance does not rise because altcoins are collapsing faster
A negative reaction would look different:
Price cuts through the level with little reaction
A bounce stalls under the broken support
Sellers defend the old floor as new resistance
Liquidations and fear spread across large-cap altcoins
The difference between a wick and a close is important. A brief move below support can flush out leveraged longs. A sustained daily close below the swing low can change the market structure.
For Bitcoin, that structure is the real issue. If price keeps forming higher lows, the broader uptrend may still be alive. If the latest major higher low fails, traders start looking for the next demand area lower down. That is when a crash can extend much further than expected.
The second critical support level belongs to Ethereum
Ethereum is the second key piece because it often shows whether the market still wants risk. Bitcoin can steady while traders remain nervous about altcoins. Ethereum is where that nervousness becomes easier to see.
The critical Ethereum support level is its current range floor. This is the lower boundary of the area where ETH has spent time trading before the latest drop. If Ethereum has been moving sideways between a clear upper and lower level, the bottom of that range becomes the line buyers need to defend.
Range floors matter because many market participants see them at the same time. Spot buyers look for value there. Short-term traders place stops around it. Sellers watch for a breakdown that could trigger fresh downside.
Ethereum’s support is especially important because ETH sits between Bitcoin and the wider altcoin market. It is large and liquid, but still more sensitive to risk appetite than Bitcoin. If ETH holds while Bitcoin stabilises, the wider market can recover more easily. If ETH breaks hard, smaller tokens often come under pressure.
There are two charts worth watching.
Ethereum priced in US dollars
The ETH/USD or ETH/USDT chart shows whether Ethereum is holding its own absolute support. This is the chart most traders use for direct price levels.
A healthy defence of support would include a strong bounce from the range floor, followed by a close back inside the prior range. If price keeps retesting the same floor and each bounce becomes weaker, that is less encouraging.
Support weakens when it gets hit too often. Buyers who stepped in the first time may not have the same strength on the fourth test.
Ethereum priced against Bitcoin
The ETH/BTC chart gives a different signal. It shows whether Ethereum is outperforming or underperforming Bitcoin.
If ETH/USD is falling but ETH/BTC is stable, the move may be mostly market-wide weakness. If ETH/USD is falling and ETH/BTC is also breaking down, Ethereum is losing ground against Bitcoin. That often points to a broader retreat from altcoin risk.
This is why the Ethereum support level is not only about a single price. It is about whether ETH can hold its range floor while avoiding a sharp relative breakdown against Bitcoin.
When Ethereum loses both at the same time, the market usually becomes more defensive. Traders move towards Bitcoin, stablecoins or cash, and liquidity drains from riskier assets.
The third critical support level is the XRP breakout shelf
XRP trades differently from Bitcoin and Ethereum. It can sit quiet for long periods, then move quickly when sentiment shifts. That makes its support levels especially important after a crash.
The critical XRP level is the breakout shelf. This is the zone where price previously broke higher, then paused or retested before continuing. In simple terms, it is the area that should act as support if the breakout was real.
Breakout shelves are powerful because they show whether buyers who missed the first move are still willing to enter on a pullback. If XRP returns to that shelf and buyers defend it, the structure remains constructive. If the shelf fails, the earlier breakout starts to look vulnerable.
For XRP, the behaviour around this level can be sharp. Price may wick below support, trigger stops, then recover quickly. That kind of move can trap late sellers. But if XRP closes below the shelf and fails to reclaim it, the chart can deteriorate fast.
A strong XRP defence would show:
A quick reaction from the breakout shelf
A daily close back above the support zone
Higher volume on the bounce than on the final sell-off candle
No immediate rejection at the first nearby resistance
A weak XRP reaction would show:
A support break with no meaningful bid
A bounce that reaches the old shelf and stalls
Lower highs forming under broken support
Continued weakness even if Bitcoin steadies
XRP is often watched by traders who like momentum. That can help it recover quickly, but it also increases the risk of crowded exits. When momentum fails, the same crowd that chased the move up can rush to reduce exposure.
That is why the breakout shelf is a cleaner signal than a random intraday low. It tells whether the prior bullish structure still has buyers behind it.

How to read the next move without guessing
The fastest way to make poor decisions during a crash is to stare at every small candle. A better approach is to build a simple confirmation map around the three support levels.
Bitcoin gives the first signal. Ethereum confirms whether risk appetite is returning. XRP shows whether speculative momentum still has life.
Use this sequence:
Signal | Bullish reading | Bearish reading |
Bitcoin at its daily swing low | Wicks below support and closes back above it | Closes below support and fails to reclaim it |
Ethereum at its range floor | Holds the floor and ETH/BTC stays stable | Breaks the floor while ETH/BTC weakens |
XRP at its breakout shelf | Reclaims the shelf after a flush | Turns the shelf into resistance |
The most constructive scenario is not a straight vertical recovery. That can happen, but it is not the only healthy outcome. A stronger recovery often looks slower at first. Price finds support, rallies, pulls back, then forms a higher low.
That higher low matters because it shows buyers are not just reacting to panic selling. They are coming back after the first bounce.
The most dangerous scenario is a failed reclaim. This happens when price breaks support, bounces back to that same zone, then gets rejected. It is one of the clearest signs that the market has shifted. Old buyers may become sellers, and short sellers may use the retest to add exposure.
There are also a few traps to avoid.
Do not assume a wick means support has failed. Crypto often moves beyond obvious levels before reversing.
Do not assume a bounce means the bottom is in. Relief rallies can be strong during downtrends.
Do not use one asset in isolation. If Bitcoin is holding but Ethereum and XRP are breaking down, the market is not giving a clean risk-on signal.
Do not forget timeframes. A level can look broken on a five-minute chart and still hold on the daily chart.
The best support reads come from alignment. If Bitcoin defends its swing low, Ethereum holds its range floor, and XRP reclaims its breakout shelf, the crash starts to look more like a washout. If all three fail, the market may need to search for lower support before real demand returns.
What traders should watch next
The next move will likely depend on whether buyers can turn panic into structure. A single bounce is not enough. The market needs to show that support can hold after the first reaction.
Watch for these signs:
Daily closes
They matter more than intraday noise, especially after a volatile session.
Reclaims
A quick recovery above support can show that sellers overextended.
Retests
The first pullback after a bounce often reveals whether buyers are serious.
Relative strength
Ethereum holding up against Bitcoin is a stronger risk signal than ETH simply bouncing in US dollar terms.
Follow-through
A support bounce needs another push higher, or it risks becoming a bull trap.
For longer-term investors, the same levels can help with patience. A crash often feels urgent, but major support zones can reduce emotional decision-making. Instead of reacting to each headline or candle, the focus stays on whether the chart is holding the areas that matter.
For shorter-term traders, these levels can define risk. If a support thesis depends on a daily swing low, a range floor or a breakout shelf, then a clean close beneath that zone changes the thesis.
That does not mean every break must be sold or every bounce must be bought. It means the market has given new information.

The takeaway
The Bitcoin Ethereum and XRP Crash Three Critical Support Levels That Could Shape the Next Move comes down to structure, not drama.
Bitcoin needs to defend its latest major daily swing low. Ethereum needs to hold its range floor while staying firm against Bitcoin. XRP needs its breakout shelf to act as real support rather than failed hype.
If those zones hold and price starts forming higher lows, the crash may turn into a reset. If they fail and become resistance, the market could face another leg lower.
The smartest move is to mark the levels, wait for confirmation, and let price prove the next direction. In a volatile crypto market, patience is often more useful than prediction.



Comments